 , and
, and  .
From parity violating asymmetries,


More detailed flavor analysis is possible with the asymmetry measurements
for W productions, since the flavors participating in the reaction are
almost fixed;
 , and
, and  .
From parity violating asymmetries,


the flavor decomposition of the anti-quark helicity distribution is possible.
We are going to identify the W production by
observing Jacobian peak in the  spectrum of leptons.
The decay electrons are detected in the EM calorimeter in Central Arm
and the decay muons are detected in North and South Muon Arms.

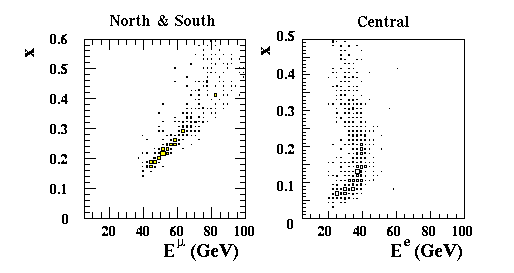
Figure 3: Correlation plot for energy of high- leptons and momentum
fraction carried by incident quark. Left plot is for the muons detected in
North and South Muon Arm, and right plot is for the electrons
detected in Central Arm.
The reconstruction of parton kinematics for W production is
difficult, since we can not measure the momentum carried by
 . As shown in the left plot in Figure 3, however,
there is a good correlation
between the muon energy and momentum fraction carried by the incident
quark,
  . This correlation is due to the angular distribution of
decay lepton in the W rest frame originated from the V-A nature of the
weak process.
In the limit of negligible
  of W,
of W,
Since  distribution follows
 ,
the first term in Equation. 10 dominates and a good correlation
between
  and
and  is obtained. Once
  is determined
 can be deduced from Equation 9 in
good approximation.
In the case of electrons detected in Central Arm, the sample are
biased in decay angle  due to the
 -coverage and both terms in Equation 10 equally
contribute. Those are, however, useful in selecting existing models
on quark and anti-quark helicity distributions.
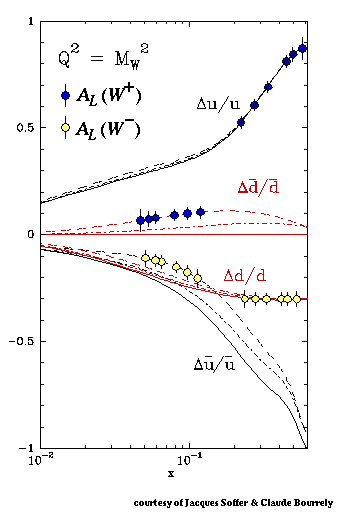
Using the muon sample which is divided into several energy bins thus x-bins, we have estimated the sensitivities of our measurements only with statistical error. Results are over-plotted on one of the model predictions for polarized structure functions [17] in Figure 4. Error bars indicate the expected statistical errors. Our measurement will be quite sensitive to both quark and anti-quark helicity distributions, though further studies are needed to minimize the background contributions.

Figure 4: Expected sensitivities for the flavor decomposed
asymmetry in the structure functions imposed on the model predictions
by Bourrely and Soffer [17].


